
Partner Knowledge Base
Configure Dashboards
When you log into the Gamma FUSION portal, the first page you will see is a dashboard. Dashboards provide at-a-glance views into key measurements such as SIM status or pool usage. There are also widgets which can be used as shortcuts to key areas in the product.
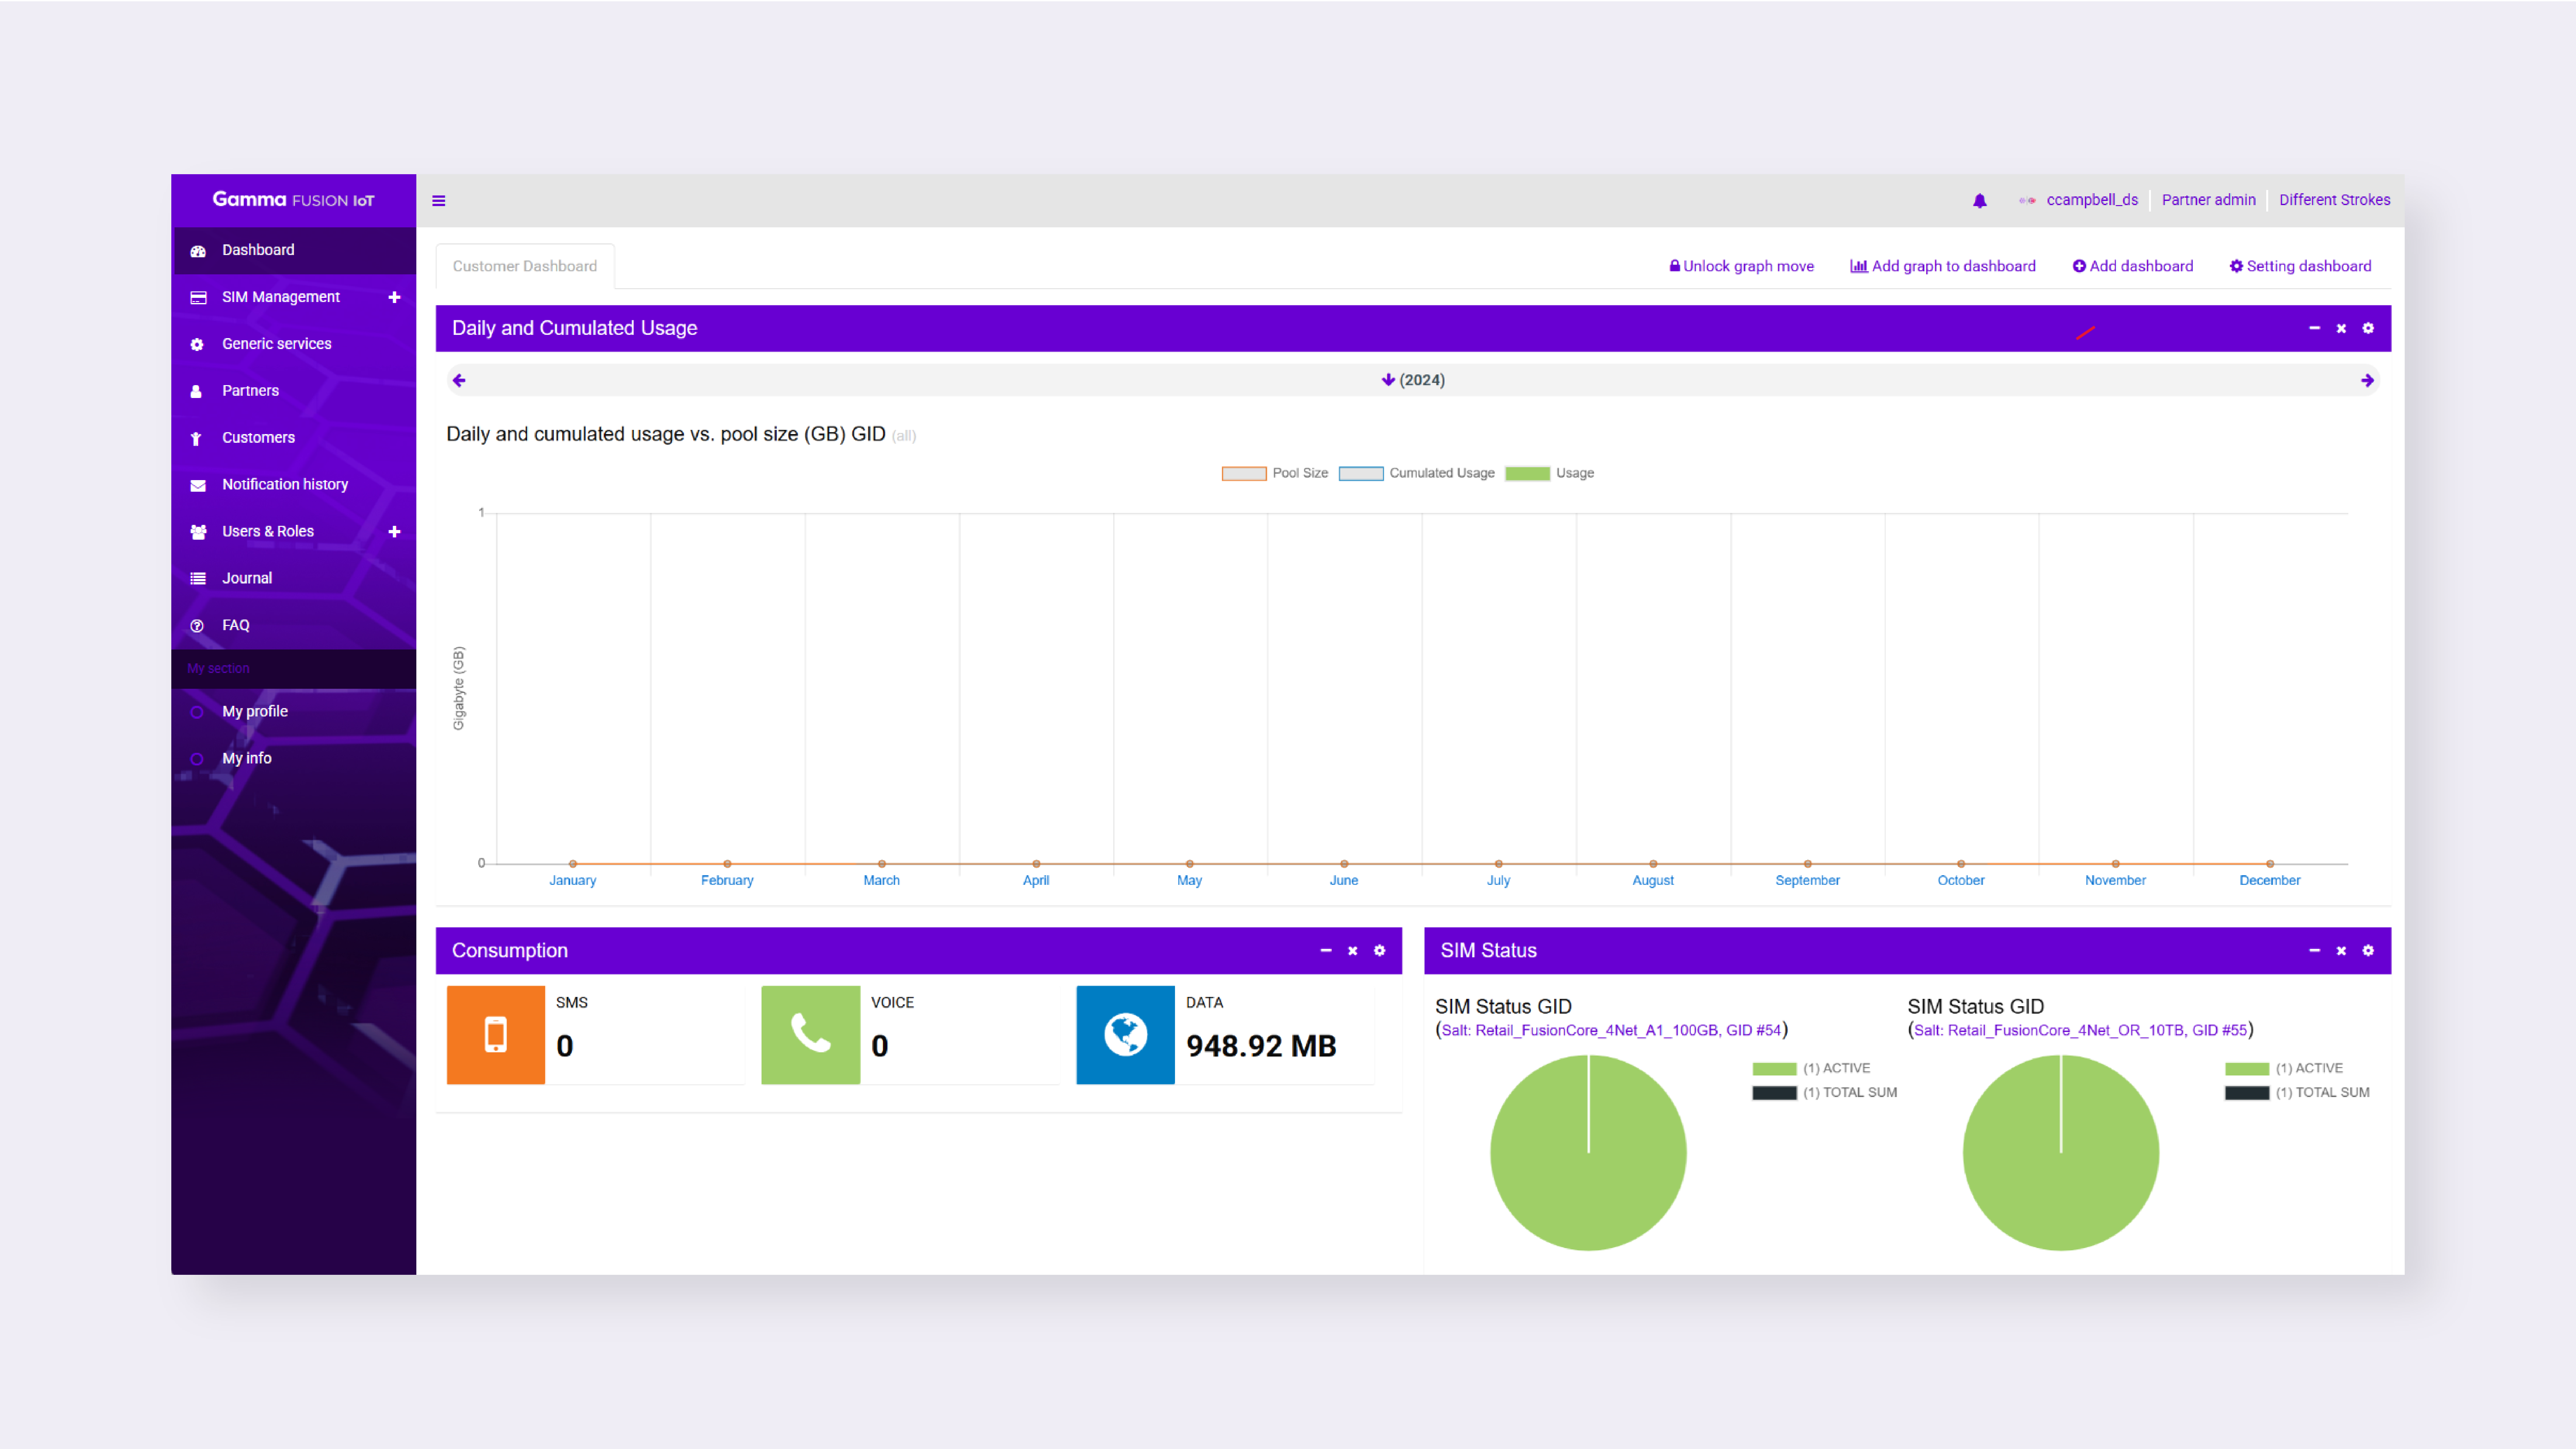
Depending on how your account was configured, the dashboard may be blank or prepopulated with information. You can customise dashboards or add additional dashboards to suit your needs.
Add a new dashboard #
- On the Dashboards page click (+) Add dashboard
- Enter the Dashboard name
- If required, tick Create renew default dashboard after next log-in
- Click Create dashboard
A blank dashboard will be created. It can then be customised.
Customise dashboards #
- On the Dashboards page click (+) Add graph to dashboard
- Select the relevant option from the dropdown
- Click Select graph
- Configure the graph as required (see customise dashboard options below)
- Click Submit
The graph will be added to the dashboard.
| Note: Items will be added to the bottom of the dashboard, you can change the order of items to suit your preferences. See Manage Dashboards for more information. |
Configure dashboard options #
When adding graphs, there are options which can be configured to determine what information is presented on the dashboard.
SIM status graph #
The SIM status graph will show you the status of the SIMs on the services you select to include in the graph.
- Enter the graph name
- Set the width and height
- Select which services to include in the graph
- If required, enable the checkbox next to Separate
- Click Submit
The graph will be added to the dashboard.
Count active SIMs #
The count active SIMs graph will monitor the number of active SIMs each day.
- Enter the graph name
- Set the width and height
- Select the group from the dropdown
- Select the default time view from the dropdown
- Select the relevant filter options
- If required, enable the checkbox next to Stacked bar
- Click Submit
The graph will be added to the dashboard.
Grafana graph #
A grafana graph lets you add URLs to the dasboard.
- Enter the graph name
- Set the width and height
- Enter the Grafana Sharing URL
- If required, enable the checkbox next to Time Change
- Select the Default time view
- Click Submit
The graph will be added to the dashboard.
Quick navigation #
The quick navigation option lets you add links to key areas in the product.
- Enter the graph name
- Set the width and height
- Enter a Description
- Enter the URL
- If required update the Icon
- Configure the background colour and icon colour
- Click Submit
The navigation option will be added to the dashboard.
Static pool usage #
The static pool usage graph will show usage over the previous month.
- Enter the graph name
- Set the width and height
- Select the relevant customer
- Select the relevant service
- Select the relevant partner service
- Select the Default time view
- Click Submit
The graph will be added to the dashboard.